With the EOBD-Facile diagnostic software, you can now observe how your vehicle’s sensors behave while driving.
But what kind of data can you view?
How do you generate a graph?
And how do you record this data?
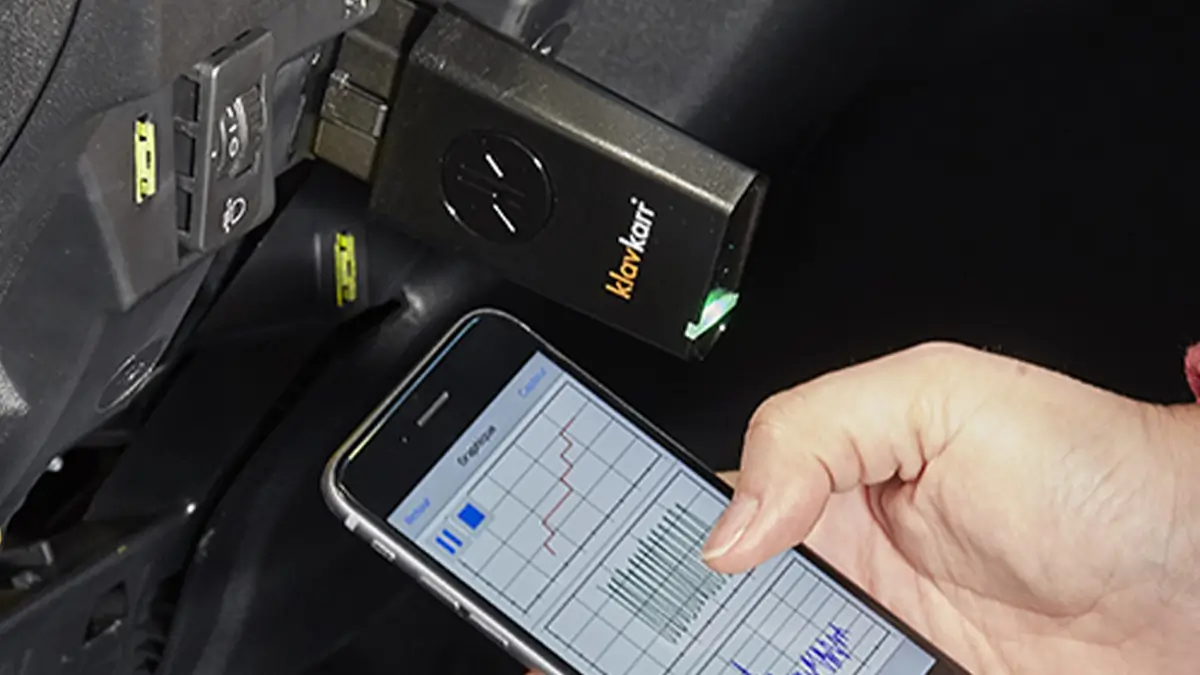

Are you looking for a car scanner ?
Why record graphs?
The graph recording feature lets you monitor how specific data evolves over time. Analysing curves helps you link sensor readings to your driving style. It can also help identify abnormal behaviour during operation.
For example, you might detect unusually high fuel consumption relative to engine RPM.
How do you generate a graph?
Generating a graph depends on the platform you’re using. The steps vary depending on your version of the EOBD-Facile software.
The method is slightly different whether you're using the desktop version or the mobile app, whether on Android or iOS.
Desktop software
Whether you’re using macOS or Windows, the process is the same. First, connect the software to your vehicle and select the ECUs you want to work with.
Then, go to the top menu and select “Additional functions”.
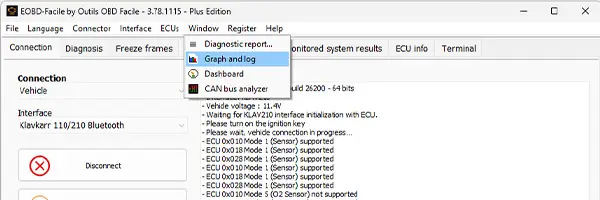
Click on “Graphs and recording”. A new window will open, allowing you to select up to 6 data channels to record simultaneously.
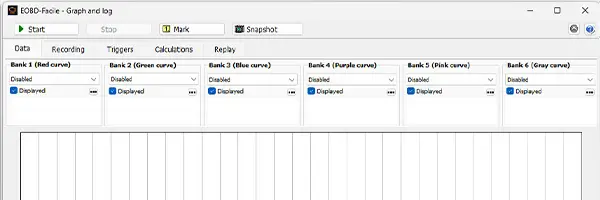
You can also define triggers to start or stop the recording automatically, and set up data conversion calculations.
Are you looking for a car scanner ?
Mobile app
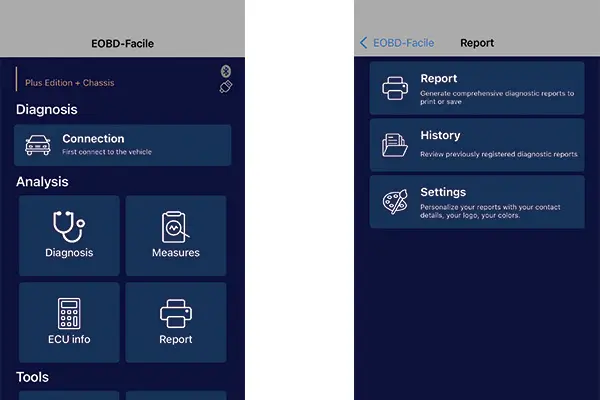
As with the desktop version, it doesn’t matter whether you’re using Android or Apple. Once connected, go to the “Measurements” menu, then tap on the “Graph” tab.
Unlike the desktop version (which allows 6 channels), the mobile app supports only 3 data channels at a time.
So if you want to analyse more than 3 sensors, you’ll need to start a new recording session.
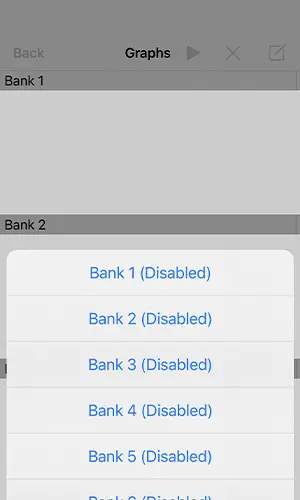
From the top-right tab, you can choose which sensor values to monitor. By tapping each channel, you can assign specific data points such as engine RPM, ignition timing, or oxygen sensor output.
Before recording, you can also customise the graph view: toggle grid lines, change background colour, adjust time scaling, or extend trace length.
And the final step to record your curves? Just drive!
In summary
Whether you’re using a smartphone or a computer, generating a diagnostic graph is simple. It gives you insight into how your vehicle responds to real driving conditions — and helps spot irregularities early.
One last tip: when recording data while driving, don’t watch the graph on your screen — keep your eyes on the road!